Power BI Projects
Menu Optimization

This Power BI dashboard provides a comprehensive analysis of restaurant menu performance, helping stakeholders identify underperforming items and high-performing departments. It highlights the 20 lowest-selling food items, visualizes gross sales by department using an interactive donut chart, and displays item sales volume to uncover trends in customer preferences. Key performance metrics like total revenue per day and per hour offer quick insights into operational efficiency. This tool supports strategic menu adjustments, revenue optimization, and smarter decision-making in a fast-paced dining environment.
Fine Dining Performance

This Power BI dashboard offers a detailed comparison of meal swipe activity across three on-campus fine dining locations between January 19 and February 15, 2025. It highlights key insights such as top-selling food items by quantity, total swipes by restaurant, and time-based trends in student dining behavior. With interactive filters for category, week, and 30-minute intervals, the dashboard allows users to explore peak service times and menu performance at a granular level. Designed to support data-driven decisions, this tool helps optimize staffing, streamline operations, and align offerings with student preferences.
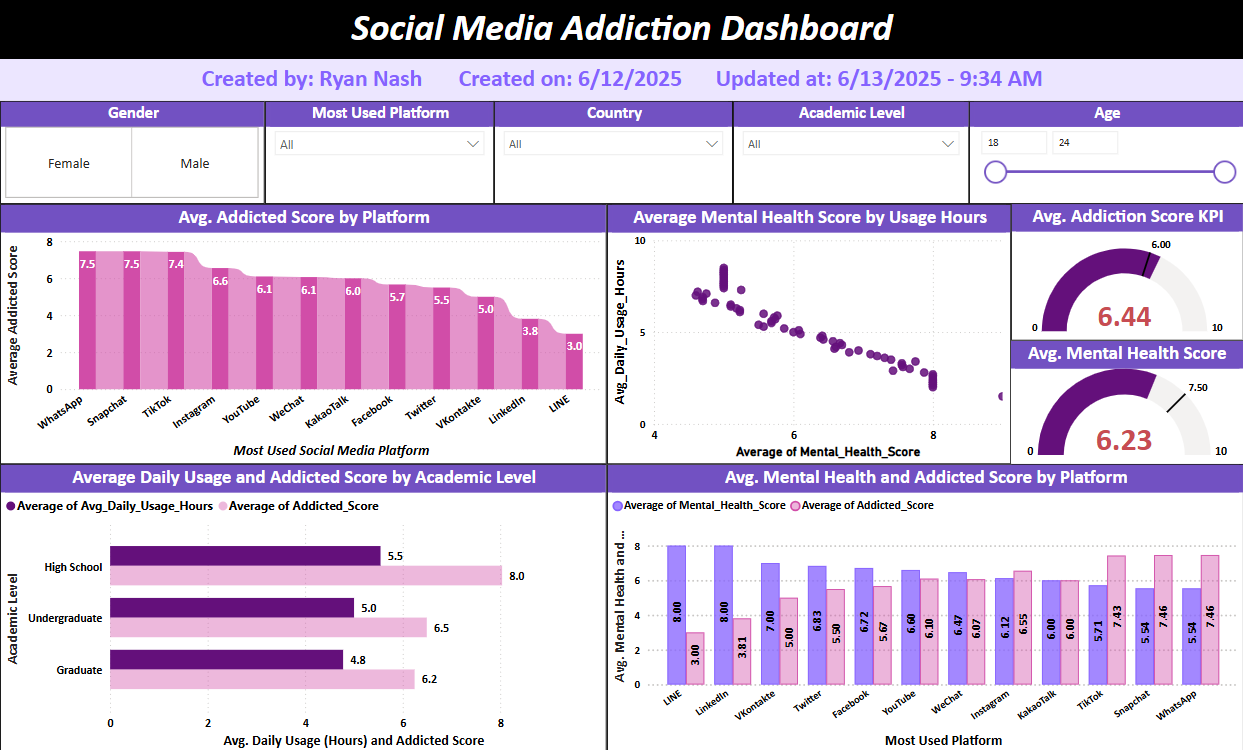
Social Media Addiction

This Power BI dashboard explores the relationship between social media usage, addiction levels, and mental health outcomes among individuals aged 18–24. It provides visual insights into platform-specific addiction scores, average daily usage by academic level, and the correlation between mental health and screen time. Interactive filters allow users to segment the data by gender, country, academic level, and relationship status. With key metrics like average addiction and mental health scores, the dashboard helps uncover patterns in digital behavior and its psychological impact—enabling deeper understanding and potential intervention strategies.
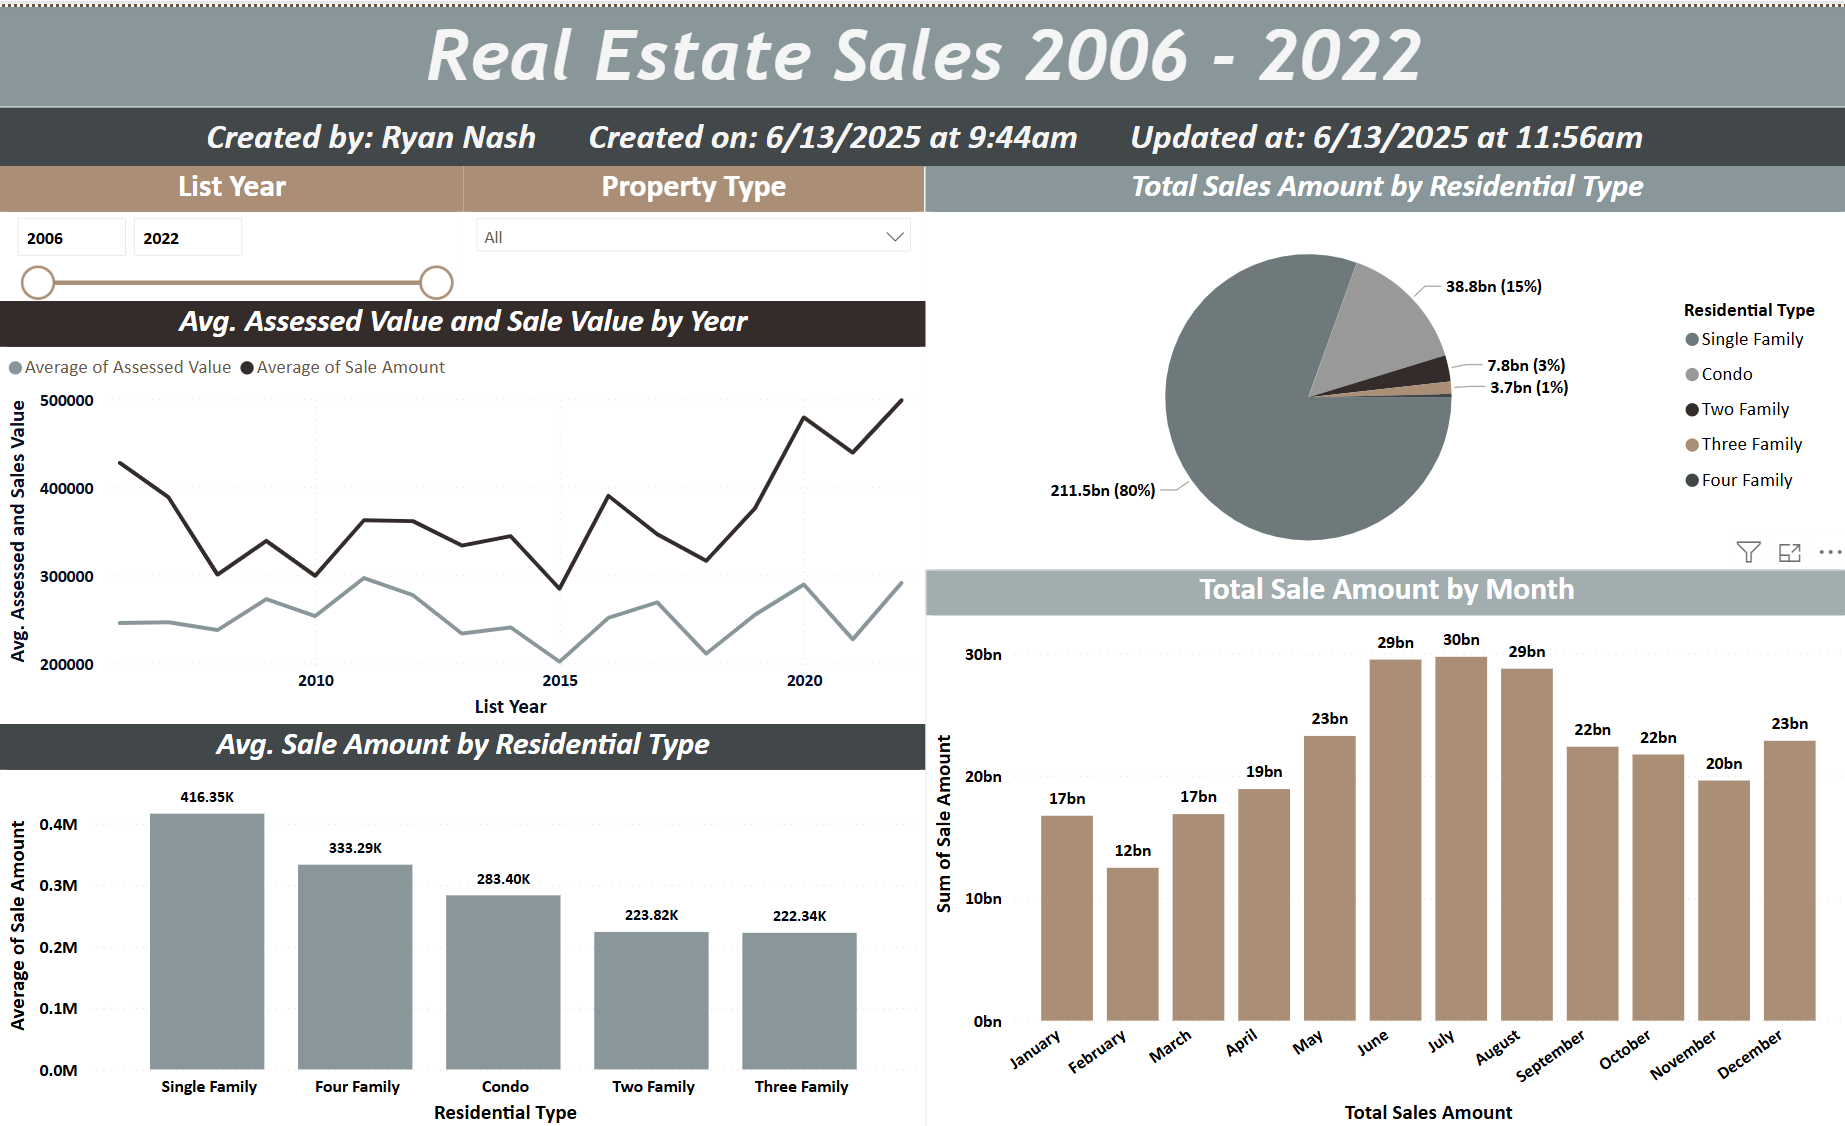
Real Estate Sales (2006-2022)
This Power BI dashboard provides a comprehensive analysis of residential real estate sales from 2006 to 2022, with insights segmented by property type, year, and month. It highlights trends in average assessed and sale values over time, identifies the most valuable property types, and reveals seasonal fluctuations in total sales volume. Users can filter by listing year and property type to uncover specific patterns. Key visuals include total sales by month, average sale amounts by residential category, and a pie chart showing the overall market share of each housing type—empowering stakeholders to better understand market dynamics, pricing behavior, and long-term value shifts in the housing sector.

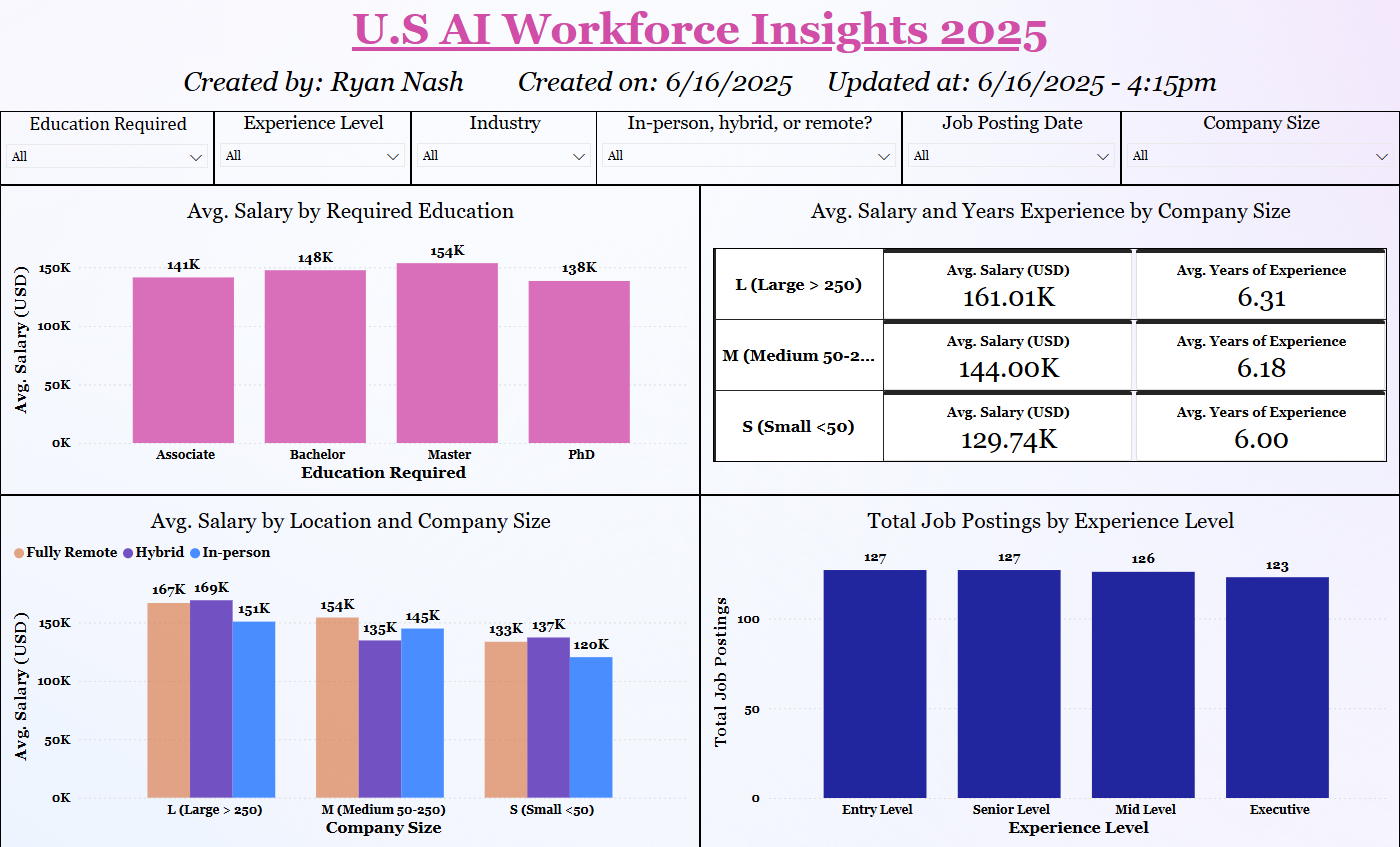
U.S. AI Workforce Insights 2025
This dashboard provides a comprehensive overview of the U.S. AI workforce in 2025, highlighting key trends in salaries, job postings, experience levels, and work arrangements. It visually breaks down how education, company size, and remote work impact earnings, offering valuable insights for AI professionals. The dashboard also displays the distribution of job postings across different experience levels, helping job seekers understand demand in the industry.

California Wildfire Damage (2014-2023)
This dashboard provides a detailed overview of the impact of California wildfires from 2014 to 2023, capturing the scale of destruction in terms of burned acreage, property loss, financial costs, and fatalities. Interactive filters allow users to explore trends by county, fire cause, and fire size, offering a clear understanding of how different factors contribute to wildfire damage. Visual elements like maps and bar charts break down losses by location and year, helping users identify high-risk areas and assess the growing toll of wildfires over time. It’s a valuable tool for researchers, policymakers, and emergency planners aiming to respond more effectively to wildfire threats.
